Sociodemographics
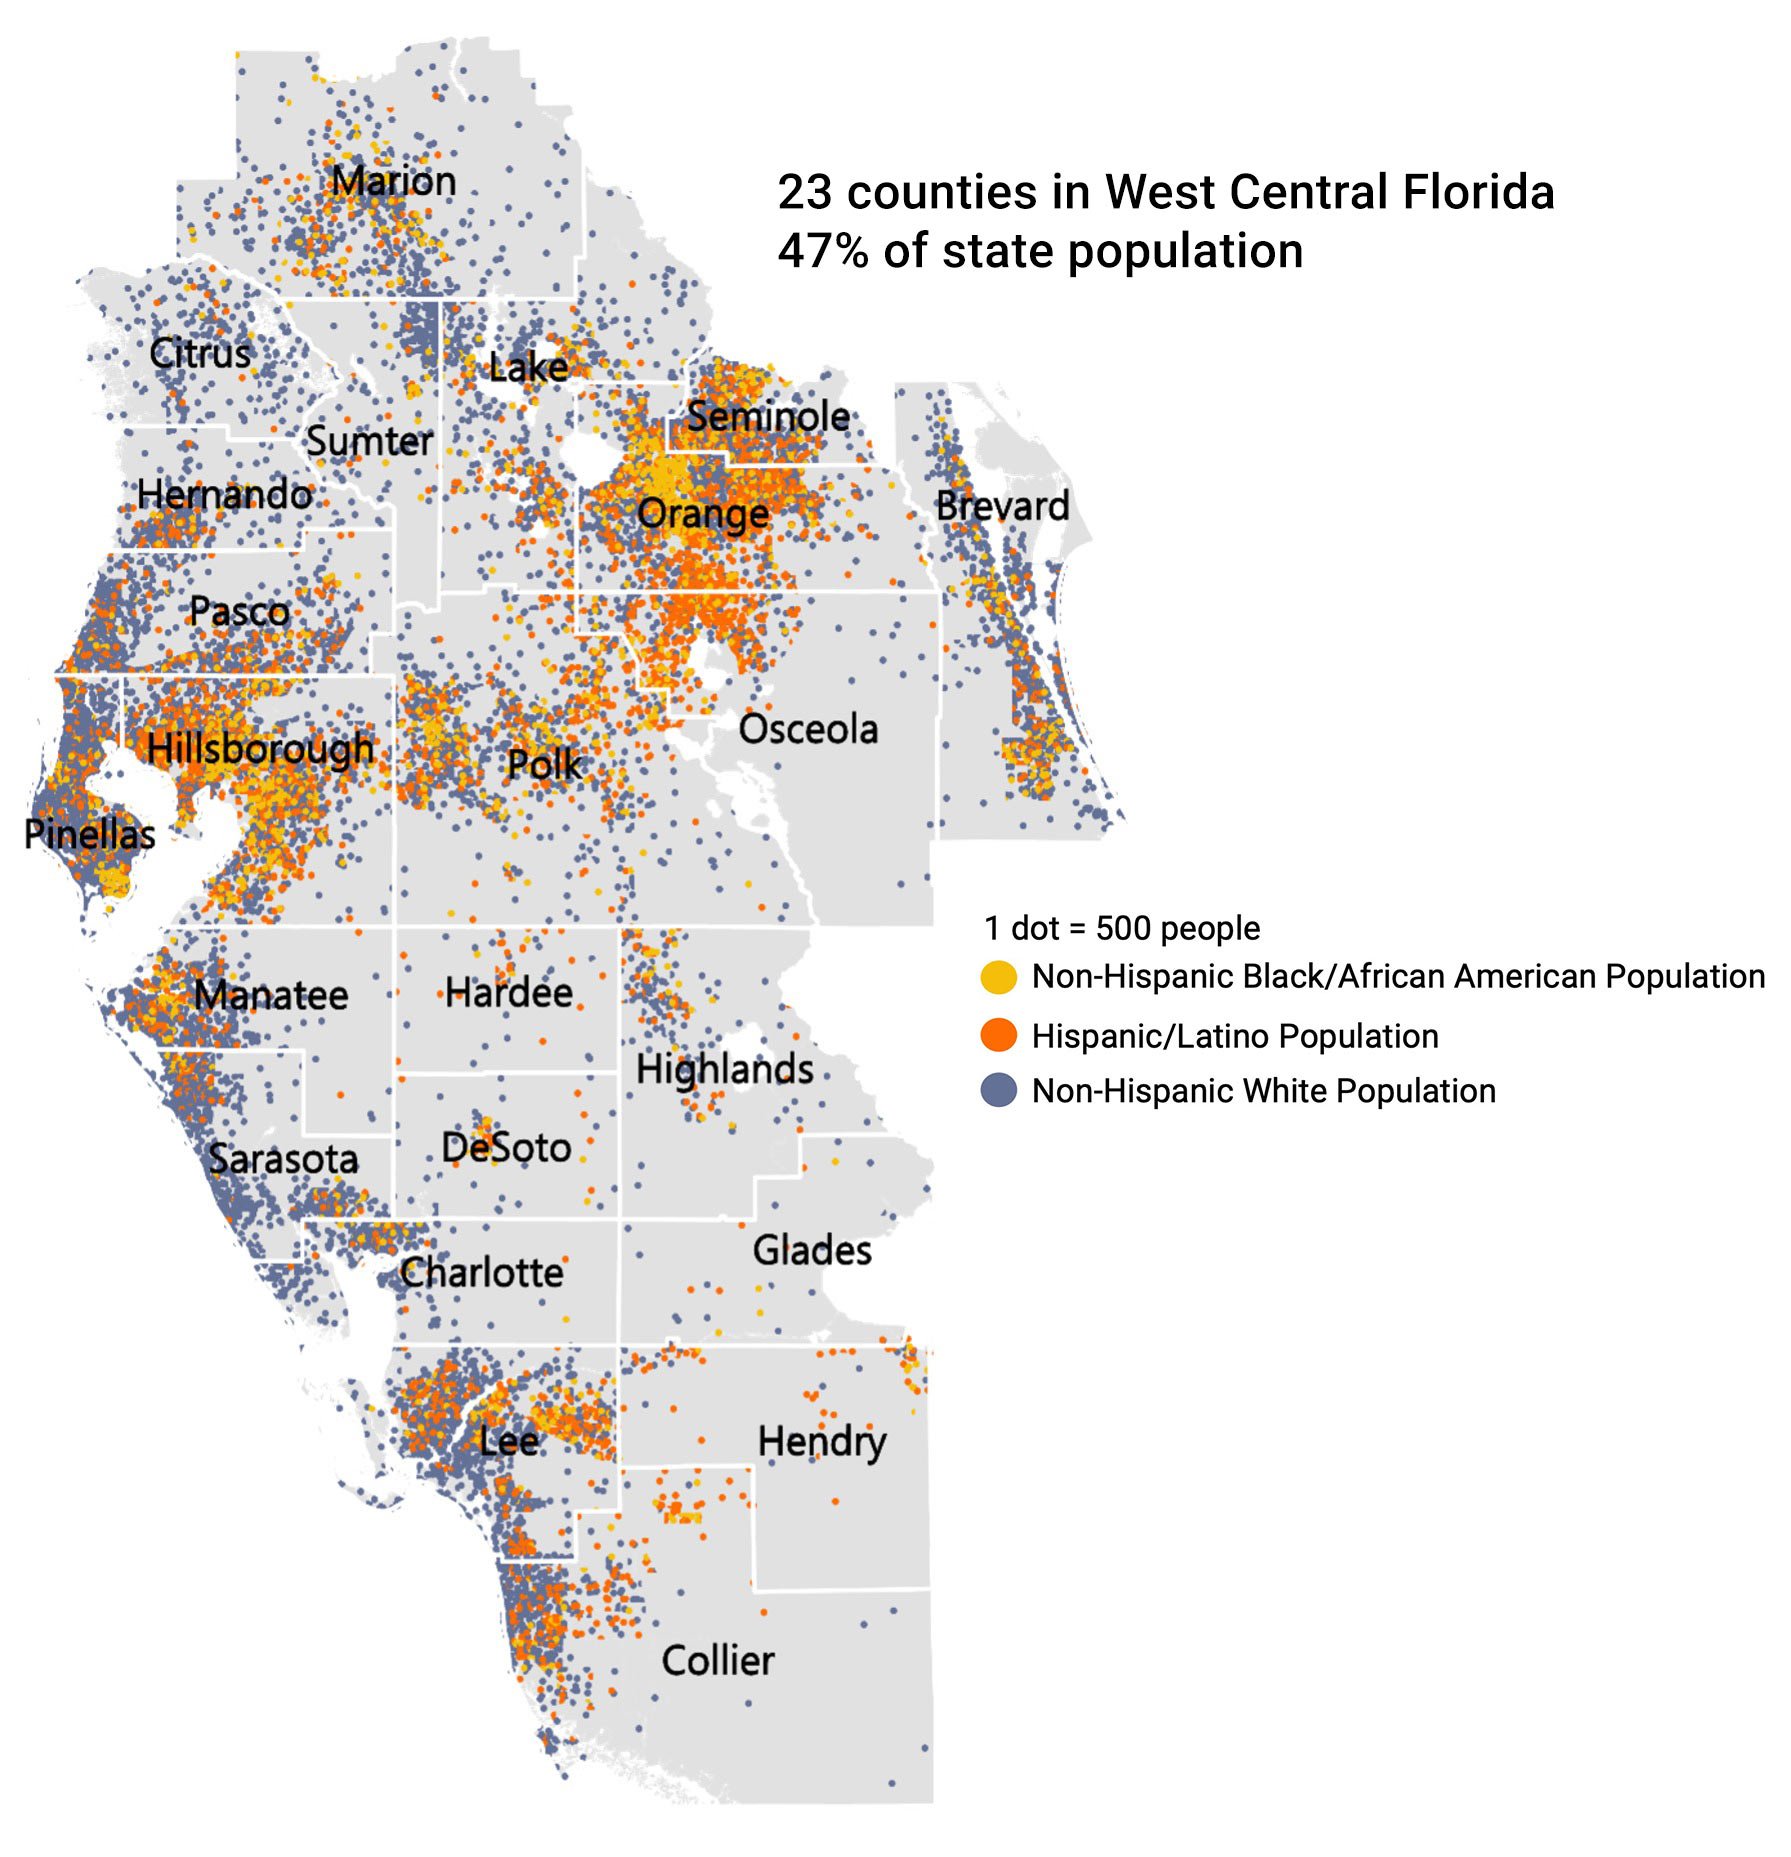
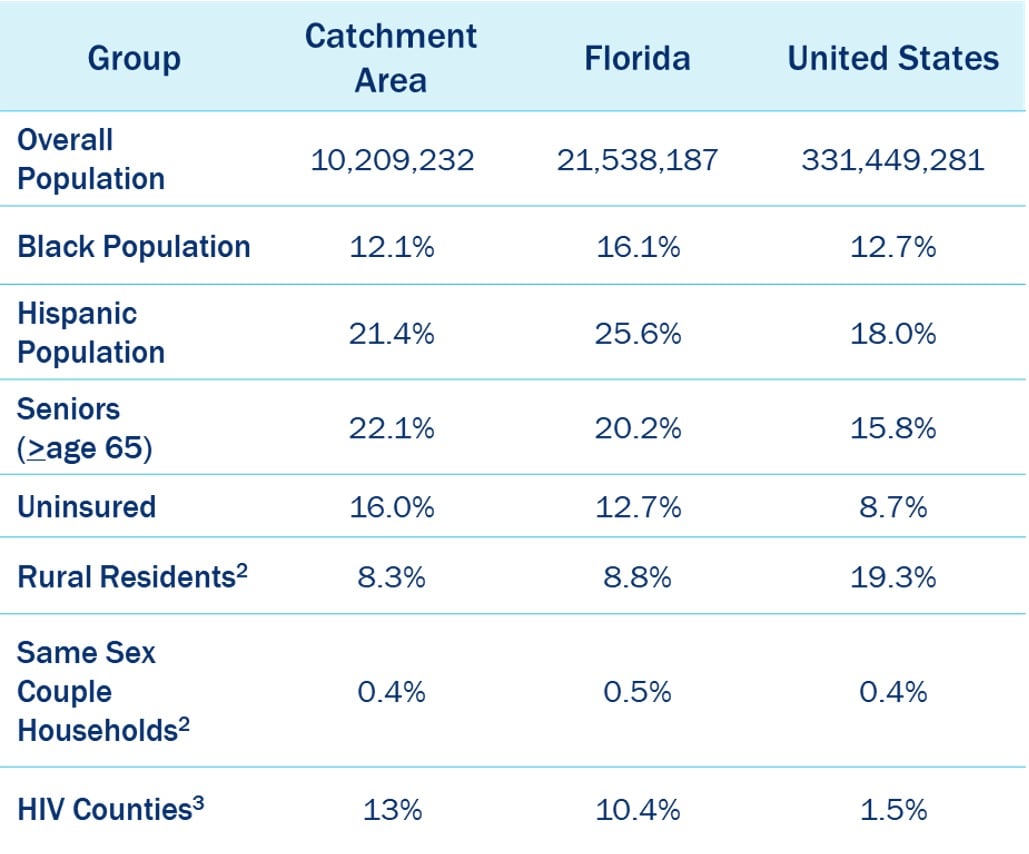
Moffitt Cancer Center Catchment Area Demographics Summary
U.S. Census Bureau, ACS Demographic and Housing Estimates, 2020 5-Year Survey.
Age: (U.S Census Bureau, ACS Demographic and Housing Estimates, 2020 5-Year Survey)
- 43% below age 18
- 40% age 18-39
- 65% age 40-64
- 10% age 65+
Diversity Index: 63.3 (0= no diversity, 100= complete diversity) (American Community Survey 2015-2019)
Rural residents: 8.3% (American Community Survey 2015-2019)
Households Below Poverty: 12.31% (American Community Survey 2015-2019)
Health Insurance: 16.0% uninsured (American Community Survey 2015-2019)
The population in Moffitt’s catchment area is similar to the U.S. population in race/ethnicity, foreign-born status, and Spanish language preference, but it is less diverse than Florida overall.
The % of those aged 65+ in the Catchment Area is higher than Florida overall and the United States (US).
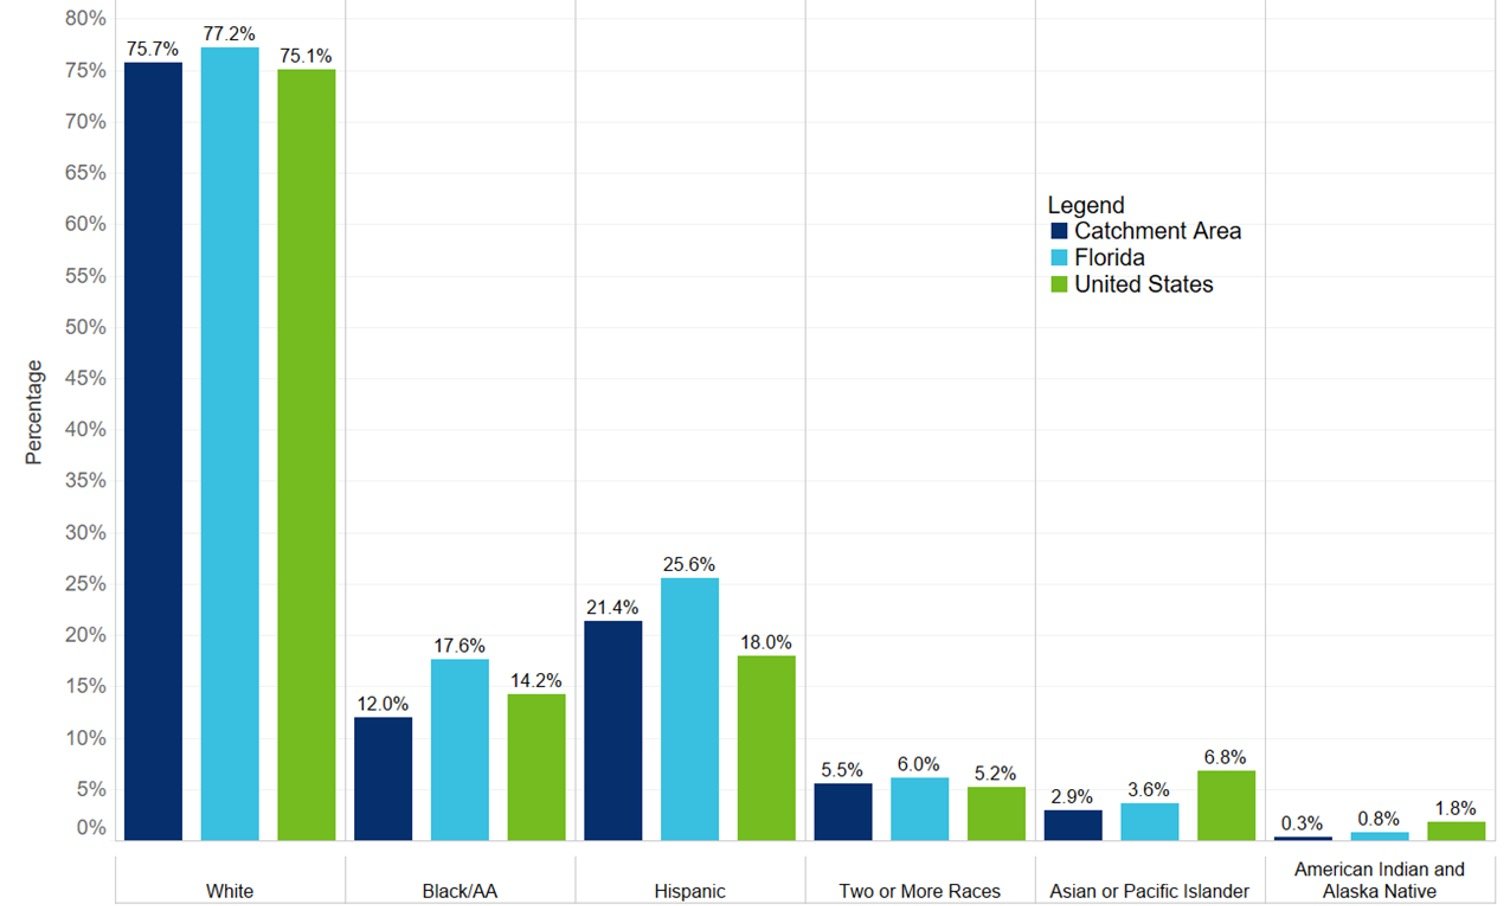
The % of Black/African American in the Catchment Area is lower than Florida overall and the U.S.
The % of Hispanics in the Catchment Area is lower than Florida overall and higher than the U.S.
The % of individuals living below poverty level in the Catchment Area is similar to Florida overall and the U.S.
The % of counties designated by the CDC as having a high percentage of new HIV cases in the Catchment Area is similar to Florida overall and much higher than the U.S.
- U.S Census Bureau, ACS Demographic and Housing Estimates, 2020 5-Year Survey;
- U.S. Census Bureau, ACS Demographic and Housing Estimates, 2021, 5-year survey; 3. CDC, Ending the HIV Epidemic in the U.S. (EHE), 2019, https://www.cdc.gov/endhiv/diagnoses-2016-2017.html
Race & Ethnicity Distribution in Catchment Area, Florida Overall, and the U.S.
Counties with the highest % of the population that is Hispanic: Osceola (54.7%), Orange (32.1%), and DeSoto (31.5%)
Counties with the highest % of the population that is African American: Orange (29.1%), Hillsborough (21.9%), and Osceola (19.6%)
Counties with the highest % of the population that identifies with 2 or more races: Osceola (8.9%), Orange (7.5%), and Hillsborough (7.4%)
U.S. Census Bureau, ACS Demographic and Housing Estimates, 2020 5-Year Survey.
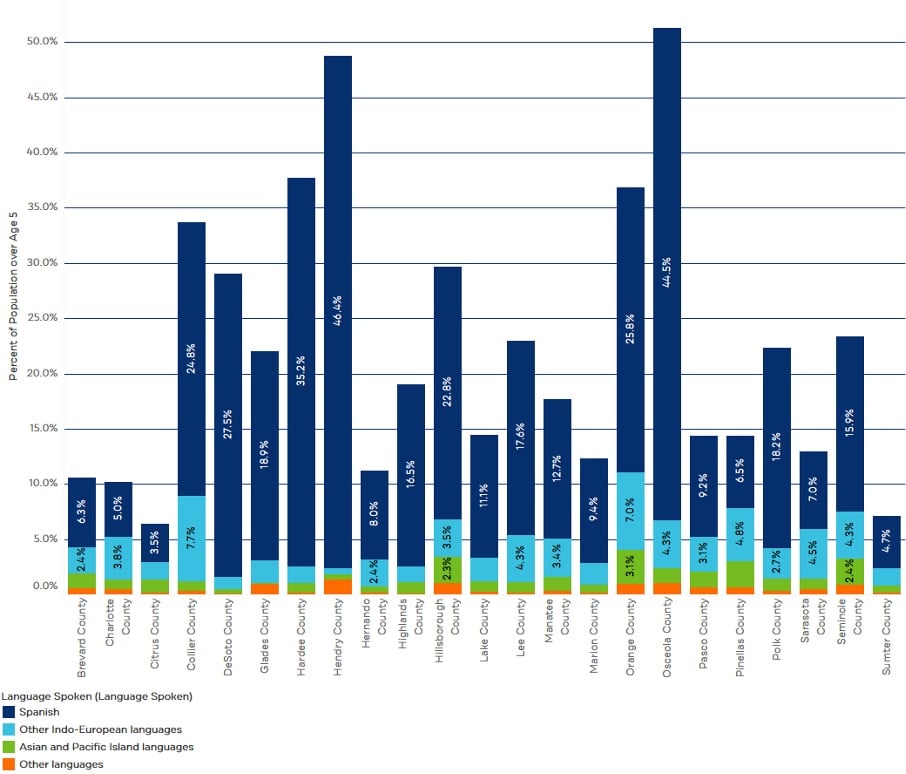
Language Spoken at Home
The majority of those in the catchment area who speak a language other than English within the home spoke Spanish (16.6% of the population), followed by other Indo-European languages (4.1% of the population), and Asian and Pacific Island Languages (1.7% of the population).
U.S. Census Bureau ACS 2015-2019
Catchment Area Cancer Data